in_file = "data.csv"
out_file = "kion10y.csv"

#CSVファイルを1行づつ読み込む
with open(in_file, "rt", encoding="Shift_JIS") as fr:
    lines = fr.readlines()

#ヘッダーを削ぎお押して、新たなヘッダーをつける
lines = ["年, 月, 日, 気温, 品質, 均質\n"] + lines[5:]
lines = map(lambda v: v.replace('/', ','), lines)
result = "".join(lines).strip()
print(result)

#結果をファイルへ出力
with open(out_file, "wt", encoding="utf-8") as fw:
    fw.write(result)
    print("saved.")
年, 月, 日, 気温, 品質, 均質
2006,1,1,3.6,8,1
2006,1,2,4.0,8,1
2006,1,3,3.7,8,1
2006,1,4,4.0,8,1
2006,1,5,3.6,8,1
2006,1,6,2.1,8,1
2006,1,7,2.8,8,1
2006,1,8,4.2,8,1平均気温
import pandas as pd

# CSVを読み込む
df = pd.read_csv("kion10y.csv", encoding="utf-8")

# 目的ごとに気温をリストにまとめる
md = {}
for i, row in df.iterrows():
    # CSVファイルの実際の列名に合わせてスペースを含めて修正
    m, d, v = (int(row[' 月']), int(row[' 日']), float(row[' 気温']))
    key = "{:02d}/{:02d}".format(m, d)
    if key not in md:
        md[key] = []
    md[key] += [v]

# 日付ごとに平均を求める
avs = {}
for key in sorted(md):
    v = avs[key] = sum(md[key]) / len(md[key])
    print("{0} : {1}".format(key, v))
01/01 : 6.0
01/02 : 6.545454545454546
01/03 : 6.145454545454546
01/04 : 6.1
01/05 : 6.4818181818181815
01/06 : 6.663636363636363
01/07 : 6.290909090909091
01/08 : 6.718181818181818
01/09 : 6.6000000000000005
01/10 : 6.0636363636363635
01/11 : 5.972727272727272
01/12 : 5.045454545454546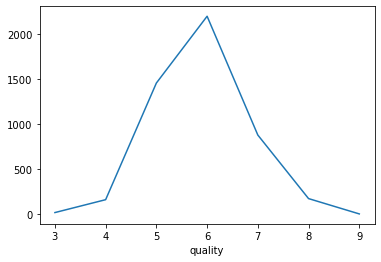
01/13 : 5.427272727272728avs["11/03"]各月の平均気温
import matplotlib.pyplot as plt
import pandas as pd

#CSVを読み込む
df = pd.read_csv("kion10y.csv", encoding="utf-8")

#月ごとに平均を求める
g = df.groupby([' 月'])[" 気温"]
gg = g.sum() / g.count()

#結果を出力
print(gg)
gg.plot()
plt.savefig("tenki-heikin-tuki.png")
plt.show()
月
1 5.996481
2 6.598714
3 10.017009
4 14.481515
5 19.607918
6 22.544848
7 26.422287
8 27.887097
9 24.360303
10 19.155132
11 13.484545
12 8.653079
Name: 気温, dtype: float64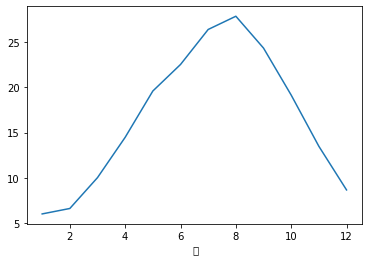
30°を超えた日は何日
import matplotlib.pyplot as plt
import pandas as pd

#ファイルを読む
df = pd.read_csv('kion10y.csv', encoding="utf-8")

#気温が30°超えのデータを調べる
atui_bool = (df[" 気温"] > 30)

#データを抜き出す
atui = df[atui_bool]

#年ごとにカウント
cnt = atui.groupby(["年"])["年"].count()

#出力
print(cnt)
cnt.plot()
plt.savefig("tenki-over30.png")
plt.show()
年
2006 2
2007 11
2008 5
2010 21
2011 9
2012 8
2013 16
2014 12
2015 7
2016 1
Name: 年, dtype: int64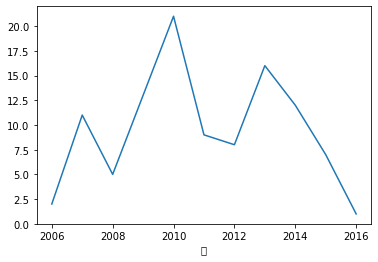
回帰分析で明日の気温予測
from sklearn.linear_model import LinearRegression
import pandas as pd
import numpy as np
import matplotlib.pyplot as plt

#気温データの10年分の読み込み
df = pd.read_csv('kion10y.csv', encoding="utf-8")

#データを学習用とテストように分割する
train_year = (df["年"] <= 2015)
test_year = (df["年"] >= 2016)
interval = 6

#過去6日分を学習するデータを作成
def make_data(data):
    x = [] #学習データ
    y = [] #結果
    temps = list(data[" 気温"])
    for i in range(len(temps)):
        if i < interval: continue
        y.append(temps[i])
        xa = []
        for p in range(interval):
            d =  i + p - interval
            xa.append(temps[d])
        x.append(xa)
    return(x, y)

train_x, train_y = make_data(df[train_year])
test_x, test_y = make_data(df[test_year])

#線形回帰分析を行う
lr = LinearRegression(normalize=True)
lr.fit(train_x, train_y)
pre_y = lr.predict(test_x)

#結果を図にプロット
plt.figure(figsize=(10, 6), dpi=100)
plt.plot(test_y, c='r')
plt.plot(pre_y, c='b')
plt.savefig('tenki-kion-lr.png')
plt.show()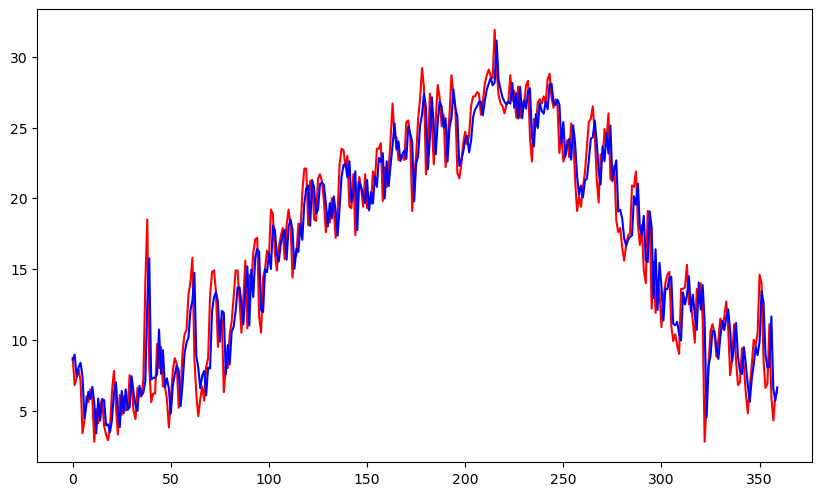
実行結果の評価
pre_y - test_yarray([-0.10002007, 2.15225572, 0.10256015, 0.15142234, 1.28187488,
4.01365434, 0.13671099, -0.56975101, 0.72603441, -0.68140458,
0.87244611, 2.7607466 , -1.70903185, 1.75737089, -1.11231561,
0.01187698, 1.83773828, 0.65039859, 1.12591734, -0.32619115,
-1.97861532, -1.57885621, 1.59928286, 1.72686513, -2.27163088,
1.68023609, -1.18539052, 1.50001243, -0.05121848, -2.25973761,
0.72214703, 1.27944462, 0.98314343, -1.63017942, 0.74598537,
0.06470342, -0.92896962, -6.94975005, -5.93966138, 7.65213866,
1.595504 , 1.11502761, 1.11392207, -2.14812766, 2.7258388 ,
-1.9074255 , 2.55773688, -0.06004565, 1.47215308, 2.75437918,
-1.01277685, -1.07156242, -1.15714278, -0.1103171 , 2.66758147,diff_y = abs(pre_y - test_y)
print("average=", sum(diff_y) / len(diff_y))
print("max=", max(diff_y))average= 1.6640684971954256
max= 8.471949619908493