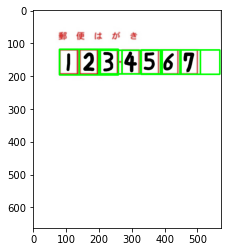
# はがきから郵便番号を抽出

import cv2
import matplotlib.pyplot as plt

# はがき画像から郵便番後う領域を抽出する関数
def detect_zipno(fname):
    #画像読み込み
    img = cv2.imread(fname)
    #画像サイズを求める
    h, w = img.shape[:2]
    #はがき画像の右上のみ抽出する
    img = img[0:h//2, w//3:]

    #画像を二極化
    gray = cv2.cvtColor(img, cv2.COLOR_BGR2GRAY)
    gray = cv2.GaussianBlur(gray, (3,3), 0)
    im2 = cv2.threshold(gray, 140, 255, cv2.THRESH_BINARY_INV)[1]

    #輪郭を抽出
    cnts = cv2.findContours(im2, cv2.RETR_LIST, cv2.CHAIN_APPROX_SIMPLE)[0]

    #抽出した輪郭を単純んあリストに変換
    result = []
    for pt in cnts:
        x, y, w, h = cv2.boundingRect(pt)
        #大きすぎる小さすぎる領域を除去
        if not(50 < w < 70): continue
        result.append([x, y, w, h])
    #抽出した輪郭が左から並ぶようソート
    result = sorted(result, key=lambda x: x[0])
    #抽出した輪郭が近すぎるものを除去
    result2 = []
    lastx = -100
    for x, y, w, h in result:
        if (x - lastx) < 10: continue
        result2.append([x, y, w, h])
        lastx = x
    #緑色の枠を描画
    for x, y, w, h in result2:
        cv2.rectangle(img, (x, y), (x+y, y+h), (0, 255, 0), 3)
    return result2, img

if __name__ == '__main__':
    #はがき画像を指定して領域を抽出
    cnts, img = detect_zipno("hagaki1.png")

    #はがきに抽出結果を描画
    plt.imshow(cv2.cvtColor(img, cv2.COLOR_BGR2RGB))
    plt.savefig("detect-zip.png", dpi=200)
    plt.show()

from detect_zip import *
import matplotlib.pyplot as plt
import pickle
# 学習済み手書き数字のデータを読込
with open("digits.pkl", "rb") as fp:
clf = pickle.load(fp)
# 画像から領域を読み込む
cnts, img = detect_zipno("hagaki1.png")
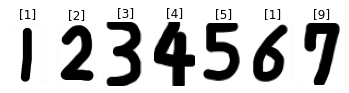
# 読み込んだデータをプロット
for i, pt in enumerate(cnts):
x, y, w, h = pt
# 枠線の輪郭分だけ小さくする
x += 8
y += 8
w -= 16
h -= 16
# 画像データを取り出す
im2 = img[y:y+h, x:x+w]
# データを学習済みデータに合わせる
im2gray = cv2.cvtColor(im2, cv2.COLOR_BGR2GRAY) # グレイスケールに
im2gray = cv2.resize(im2gray, (8, 8)) # リサイズ
im2gray = 15 - im2gray // 16 # 白黒反転
im2gray = im2gray.reshape((-1, 64)) # 一次元に変換
# データ予測する
res = clf.predict(im2gray)
# 画面に出力
plt.subplot(1, 7, i + 1)
plt.imshow(im2)
plt.axis("off")
plt.title(str(res))
plt.show()